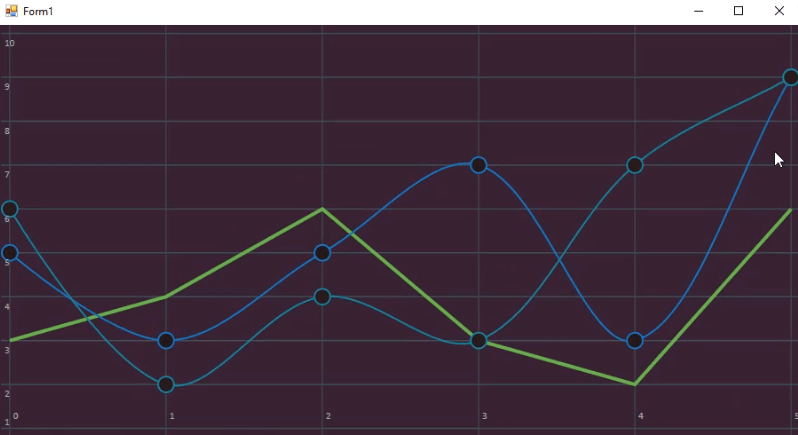
Live Chart (Cartesian Chart) Demo in C# win form app
Live Chart's In C#
Hello everyone, welcome back me Rashid Hussain. Coming back with another tutorial video onHow to create Cartesian Chart in WinForm App C#.
Tools Required:
Visual Studio 2012 or later version.
Code Behind
cartesianChart1.Series.Add(new LineSeries
{
Values=new ChartValues { 3,4,6,3,2,6},
StrokeThickness=4,
StrokeDashArray=new System.Windows.Media.DoubleCollection(50),
Stroke=new SolidColorBrush(System.Windows.Media.Color.FromRgb(107,185,79)),
Fill=Brushes.Transparent,
LineSmoothness=0,
PointGeometry=null
});

cartesianChart1.Series.Add(new LineSeries
{
Values=new ChartValues { 5,3,5,7,3,9},
StrokeThickness=2,
Stroke=new SolidColorBrush(System.Windows.Media.Color.FromRgb(26,122,192)),
Fill=Brushes.Transparent,
PointGeometrySize=20,
PointForeground=new SolidColorBrush(System.Windows.Media.Color.FromRgb(34,22,27))
});

cartesianChart1.Series.Add(new LineSeries
{
Values = new ChartValues { 6, 2, 4, 3, 7, 9 },
StrokeThickness = 2,
Stroke = new SolidColorBrush(System.Windows.Media.Color.FromRgb(29 ,137, 152)),
Fill = Brushes.Transparent,
PointGeometrySize = 20,
PointForeground = new SolidColorBrush(System.Windows.Media.Color.FromRgb(40, 26, 29))
});

cartesianChart1.Background = new SolidColorBrush(System.Windows.Media.Color.FromRgb(55, 32, 49));
cartesianChart1.AxisX.Add(new Axis
{
IsMerged=true,
Separator=new Separator
{
StrokeThickness=1,
StrokeDashArray=new DoubleCollection(2),
Stroke=new SolidColorBrush(System.Windows.Media.Color.FromRgb(64,79,86))

}
});
cartesianChart1.AxisY.Add(new Axis
{
IsMerged = true,
Separator = new Separator
{
StrokeThickness = 1.5,
StrokeDashArray = new DoubleCollection(4),
Stroke = new SolidColorBrush(System.Windows.Media.Color.FromRgb(64, 79, 86))

}
});
Video Tutorial
Source Code
Thanks for visiting us. Please don’t forget to subscribe our official YouTube Channel RashiCode